The loss of stellar visibility in Europe

Maps of the loss of naked eye limiting magnitude at zenith
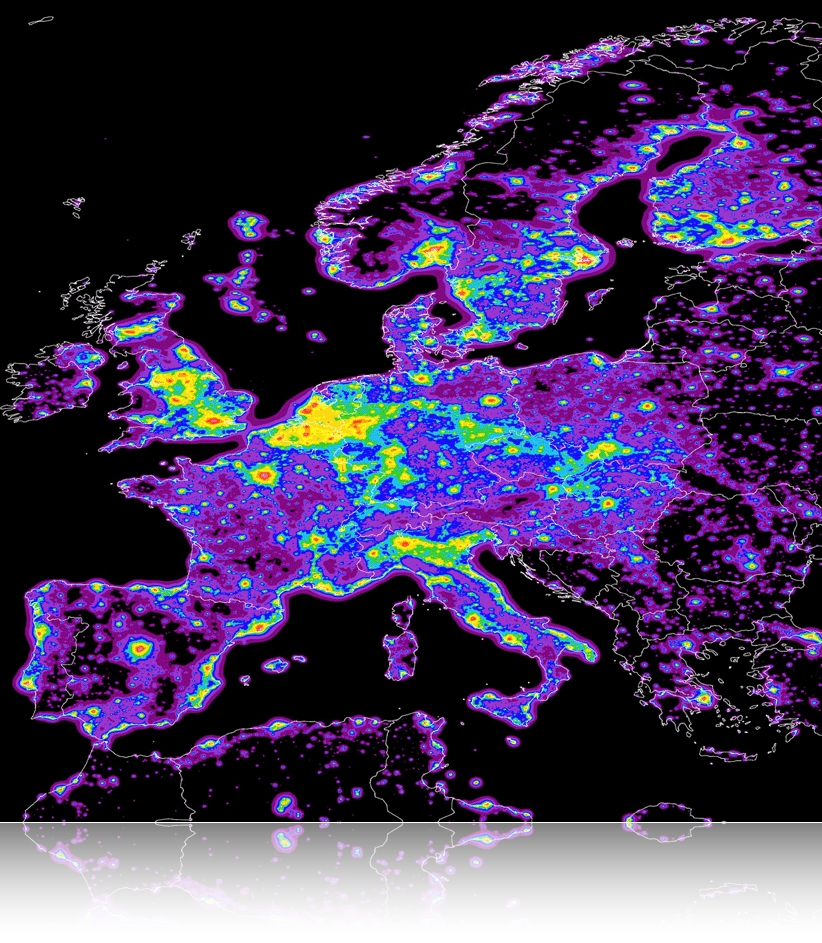
This map show the loss of the capability of the population to see the stars in Europe. It is obtained simply by the difference between a map of the star visibility and a map of the same quantity evaluated assuming no light pollution in the area. The loss of naked eye limiting magnitudes is computed for observers of average experience and capability, aged 40 years, with the eyes adapted to the dark, observing with both eyes toward the zenith the first star surely seen. Levels correspond to magnitude loss (in V mag.):
black >0.1, purple 0.1-0.2, orchid 0.2-0.4, blue 0.4-0.6, light blue 0.6-0.8, green 0.8-1.0, golden yellow 1.0-1.2, yellow 1.2-1.4, orange 1.4-1.6, red 1.6-1.8, hot pink 1.8-2.0, pink <2.0.
This map is copyright but may be reproduced by the press in articles citing the research of the Light Pollution Science and Tecnology Institute (ISTIL) with the following credit/copyright statement:
Credit: P. Cinzano (University of Padova and ISTIL), F. Falchi (University of Padova), C. D. Elvidge (NOAA National Geophysical Data Center, Boulder). Copyright 2001 ISTIL, Thiene. Reproduced from www.savethenight.eu.
See also the map of Lights in Europe.
We are indebted to Dr. Francesco Cinzano of Farmacia alla Madonna in Thiene for his support.